Cost Analytics
Compare payroll costs across Office, Department, Payroll Group or Cost Center.
Filter and compare
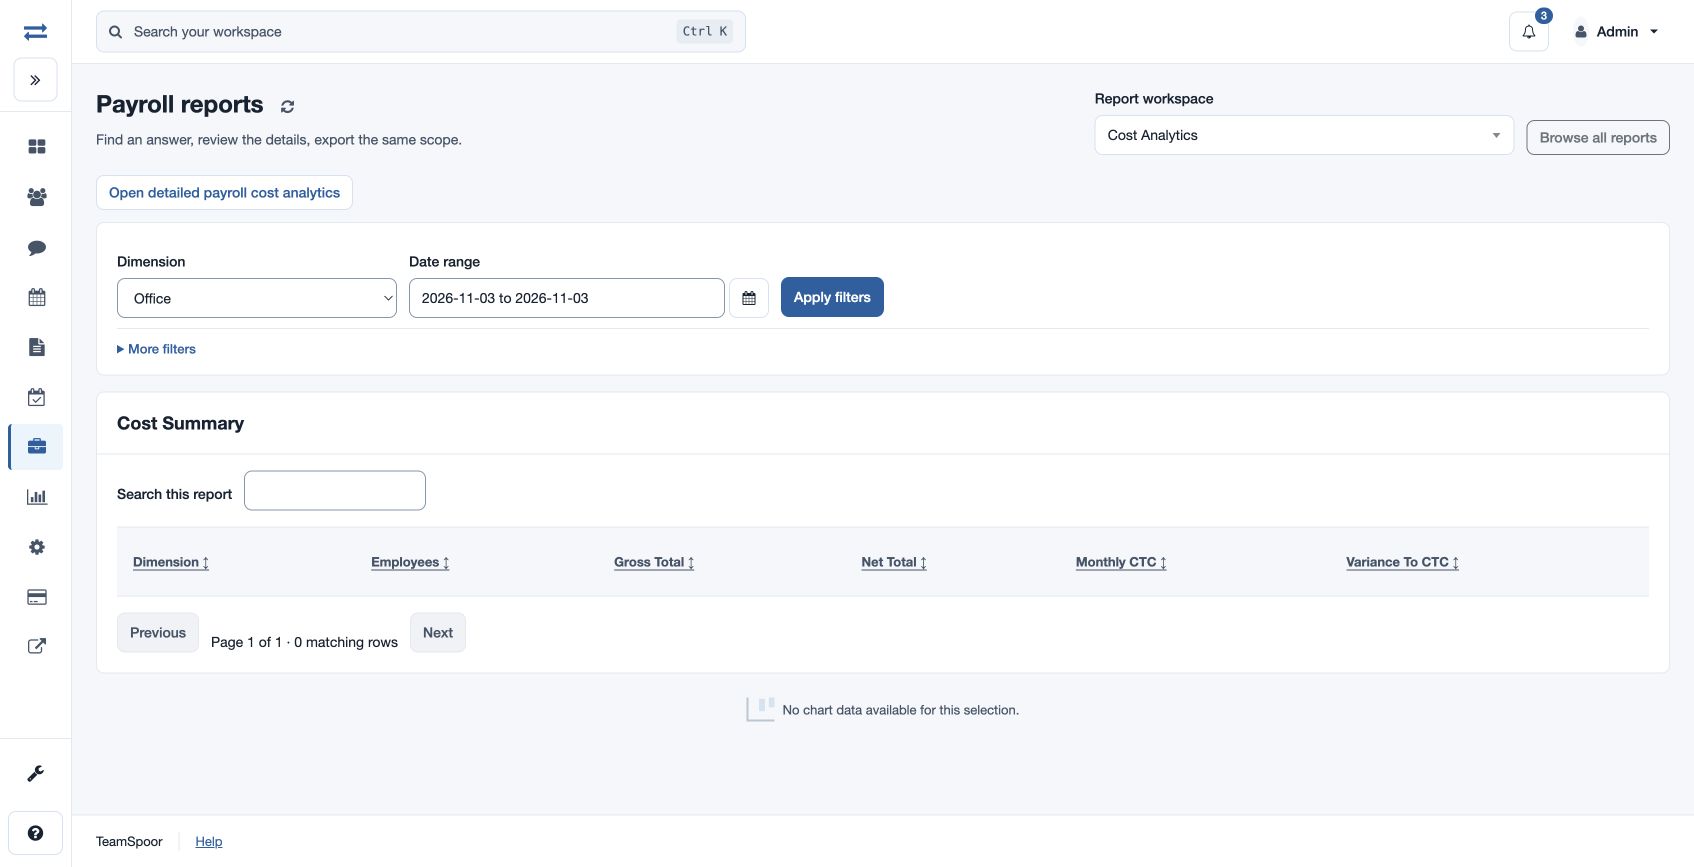
Open Payroll → Reports → Cost Analytics. Choose Dimension: Office, Department, Payroll Group or Cost Center; set the date range and an Office under More filters, then Apply filters. Cost Summary shows Dimension, Employees, Gross Total, Net Total, Monthly CTC and Variance To CTC. The variance is gross total minus mapped monthly CTC; review the date range and population before interpreting it as a difference. Use Search this report, sortable headings and the page controls. Charts summarize the result when data exists.
For a deeper breakdown choose Open detailed payroll cost analytics. If no rows appear, check the selected dates, office and payroll report access.
Access and scope
The payroll feature and payroll cost report permission are required. Results are limited to your permitted scope. If a report exceeds 2,000 entries, narrow the selected period or scope and run it again.
Interpret the selection
Dimension identifies the selected office, department, payroll group or cost center; Employees counts the grouped employees. Gross Total and Net Total come from payroll results in the date selection. Monthly CTC is the mapped monthly amount; Variance To CTC subtracts that amount from Gross Total. A multi-month gross total and one monthly CTC measure are not directly equivalent.
For fictional North Sales, use a one-month period and compare gross 110,000 with mapped monthly CTC 100,000; the displayed variance is 10,000. Check employee allocations and the payroll results for the same scope before drawing a conclusion.