Dashboard
Read the company overview and follow up on field activity.
Set the dashboard scope
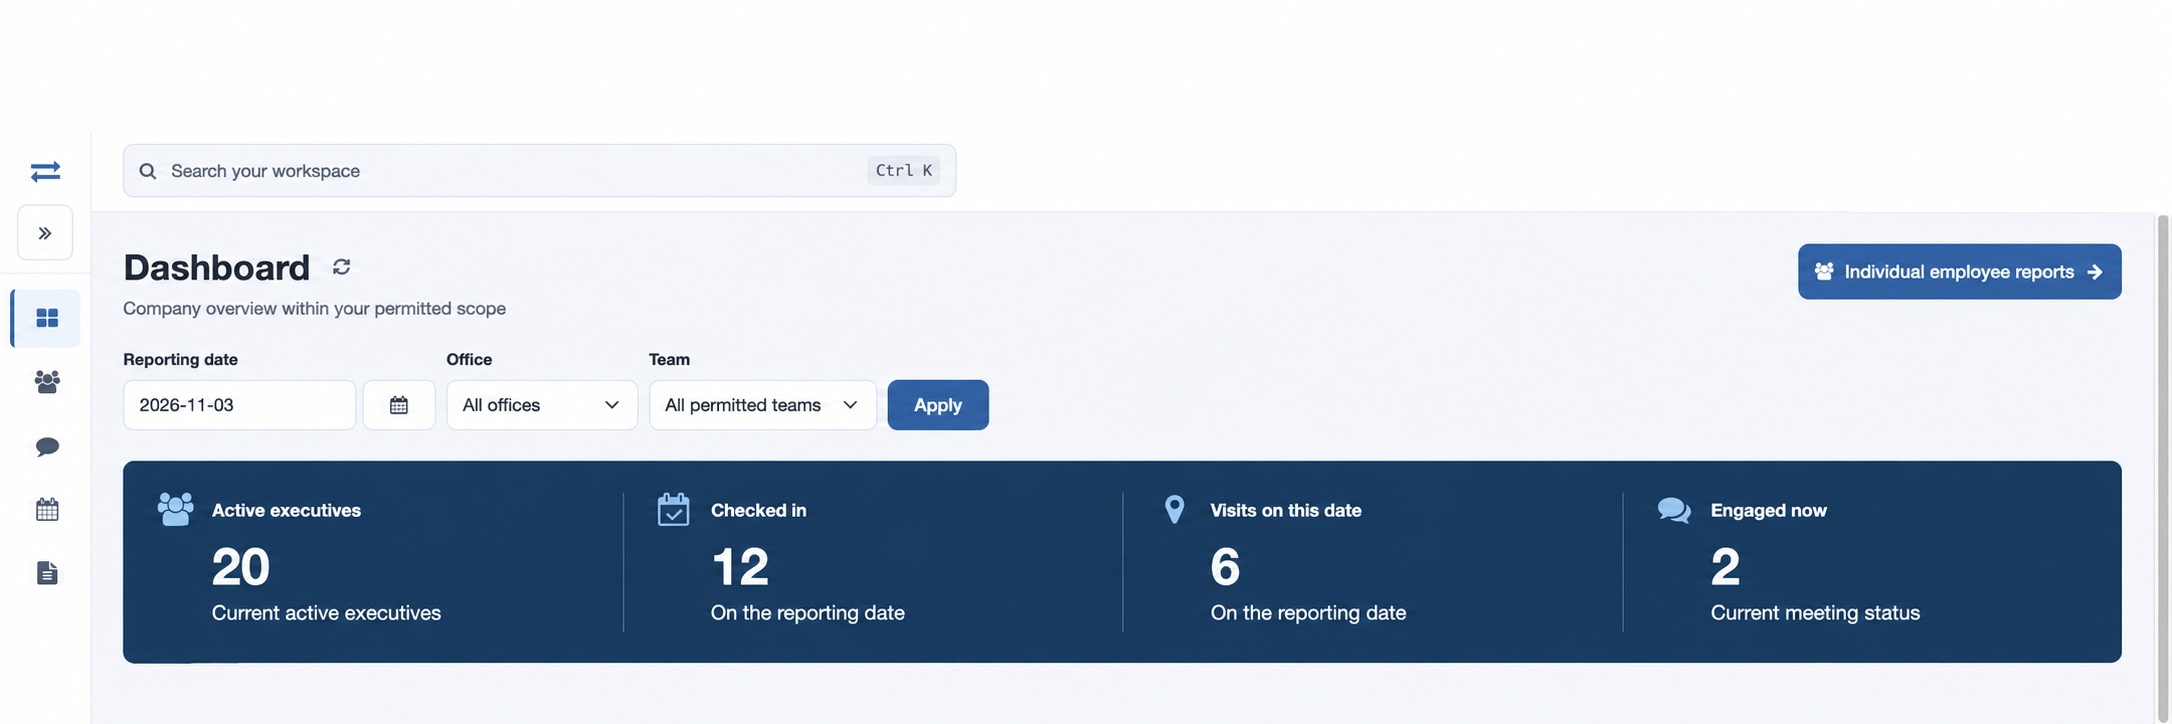
The Dashboard shows a company overview within your permitted scope. Choose a Reporting date, Office and Team, then select Apply. Office and team choices depend on your access. Use the refresh button to reload report data.
Read the overview
- Active executives is the current active population. Checked in and Visits on this date refer to the selected reporting date. The visits count opens the filtered visit report.
- Engaged now is current meeting status, even when a past reporting date is selected.
- Visit activity compares the seven days ending on the reporting date with the previous seven days. Expand View chart values for the underlying values.
- Check-in coverage shows recorded check-ins, not an absence calculation. Needs attention summarizes earlier open clock-outs and pending requests.
- Team activity compares active executives, check-in coverage, executives with visits and visits. Select a team to narrow the dashboard. Recent visits lists the latest five on the chosen date.
- Location exceptions shows current signals for the selected office and team. Device-reported location times and mock flags require follow-up; an old update alone does not prove a device is offline.
Follow up
For example, select a fictional North office and Sales team for a specific date, compare visits and coverage, then open Individual employee reports to investigate. If nothing appears, check the date, scope and whether activity was recorded; refresh before assuming data is missing.
Interpret dashboard periods
Check each card’s displayed period before comparing it with a report. Current profile and assignment information can differ from the selected reporting date. Open the related report when a total needs supporting records, and check date and employee scope if counts differ.